Warning
This article and series is specifically targeted for anyone involved or interested in oil and gas reserves reporting guidelines, methods, issues, calculations and pitfalls. Proceed at your own risk!
Introduction
In our previous articles, we discussed the SEC price determination methodology and best practices for calculating differentials. Coupled together, these important topics lead us into the next discussion. What if we want to employ a forward-looking price basis for economic evaluations? SEC pricing is designed to be a robust, interpolative result from historical data, ignoring forward-looking market trends. In this discussion, we will 1. identify how SEC prices can be misleading or decoupled from current markets, 2. introduce the futures market, and 3. provide best practices for determining futures strip pricing.
SEC Prices and Actual Markets
Recent history has shown three (3) cases where the last 12-month (LTM) average SEC price 1. overestimated actual prices, 2. underestimated actual prices, and 3. reasonably represented actual prices. In each case, the futures strip price tracked actual prices with relative precision in comparison to the respective SEC price. Let’s review three WTI-Cushing crude oil cases.
Case 1 (Year-end 2014): Crude oil prices retreated sharply from October 2014 through the end of the year, resulting in an overinflated LTM average SEC price relative to actual forecasted prices and prices received beyond 2014. The SEC price for year-end 2014 was 94.99 $/bbl, with actual spot prices dipping to 47.92 $/bbl by mid-January of 2015. The SEC price used for year-end 2014 was 102% above the actual average spot prices for the first three (3) years from the effective date, while the respective futures prices for were 32% above the actual average spot prices over the same period. See figure 1 below for more details.
Case 2 (Year-end 2016): Crude oil prices rebounded steadily from February 2016 through the end of the year, resulting in an underinflated LTM average SEC price relative to actual forecasted prices and prices received. The SEC price for year-end 2016 was 42.75 $/bbl, with actual spot prices increasing from 52.71 $/bbl in mid-January of 2017 to 71.09 $/bbl by July 2018. The SEC price used for year-end 2016 was 25% below the actual average spot prices for the first three (3) years from the effective date, while the respective futures prices for were 1% below the actual average spot prices over the same period. See figure 2 below for more details.
Case 3 (Year-end 2015): Crude oil prices remained range bound between 40-60 $/bbl for much of 2015, resulting in a balanced LTM average SEC price relative to actual spot prices. The SEC price for year-end 2015 was 50.25 $/bbl, with actual spot prices remaining within a similar range for much of 2016-2019. The SEC price used for year-end 2016 was 3% below the actual average spot prices for the first three (3) years from the effective date, while the respective futures prices for were 13% below the actual average spot prices over the same period. See figure 3 below for more details.
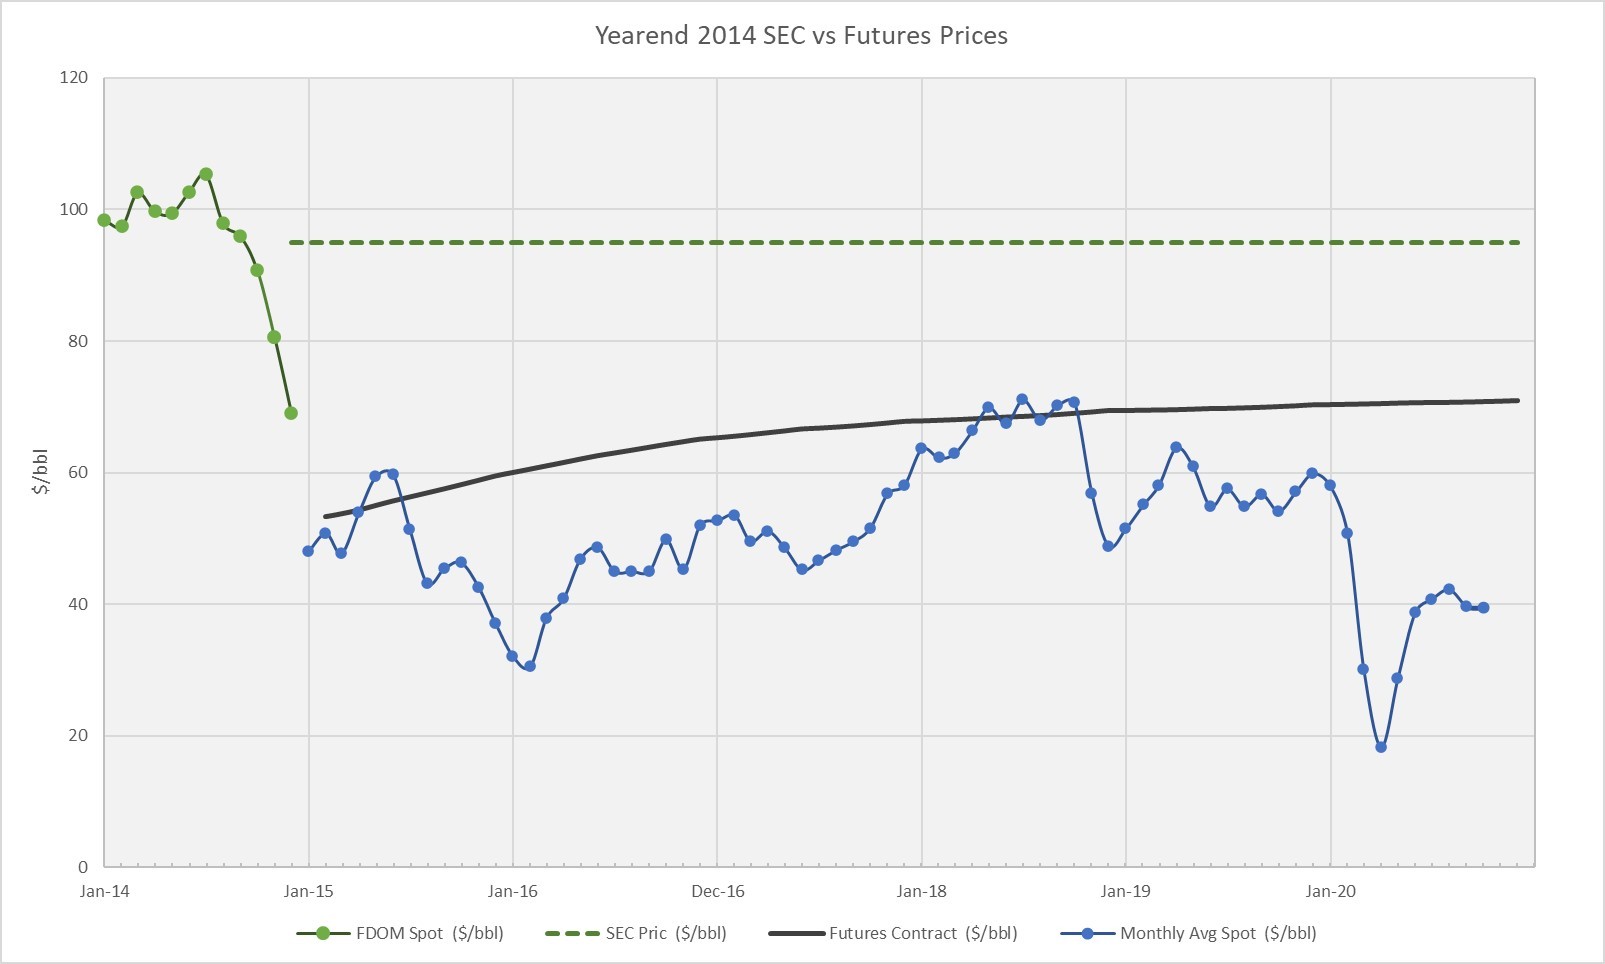
Figure 1 – Case 1: Year-end 2014 SEC price vs Futures Prices
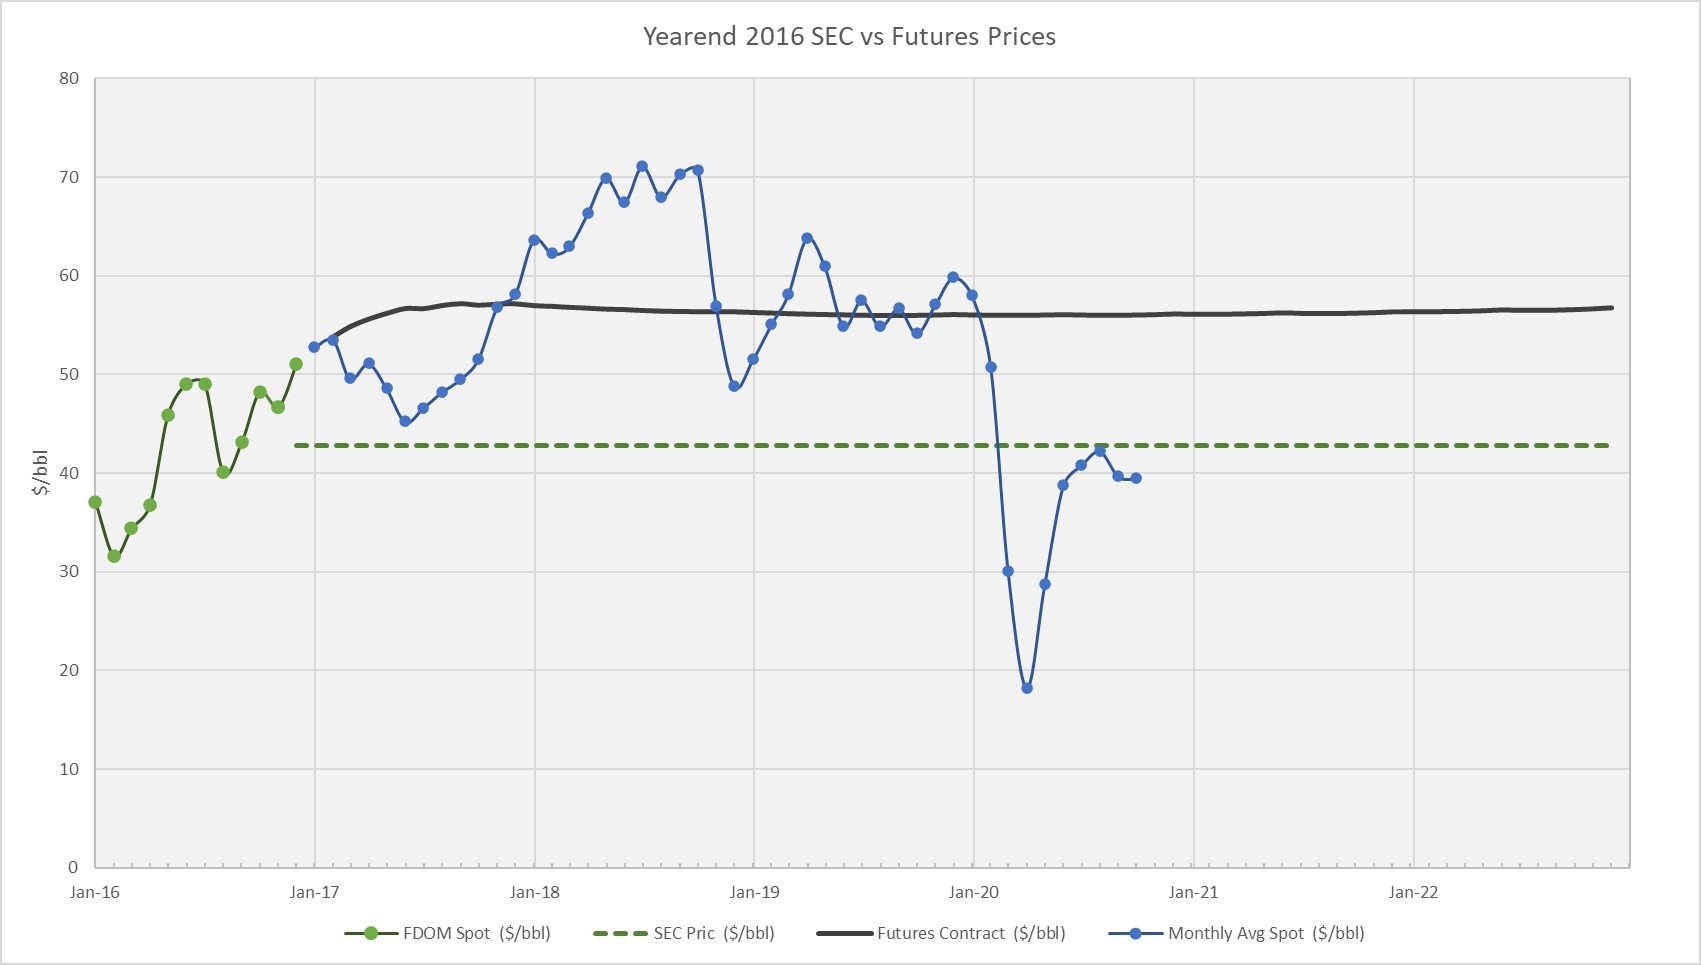
Figure 2 – Case 2: Year-end 2016 SEC price vs Futures Prices
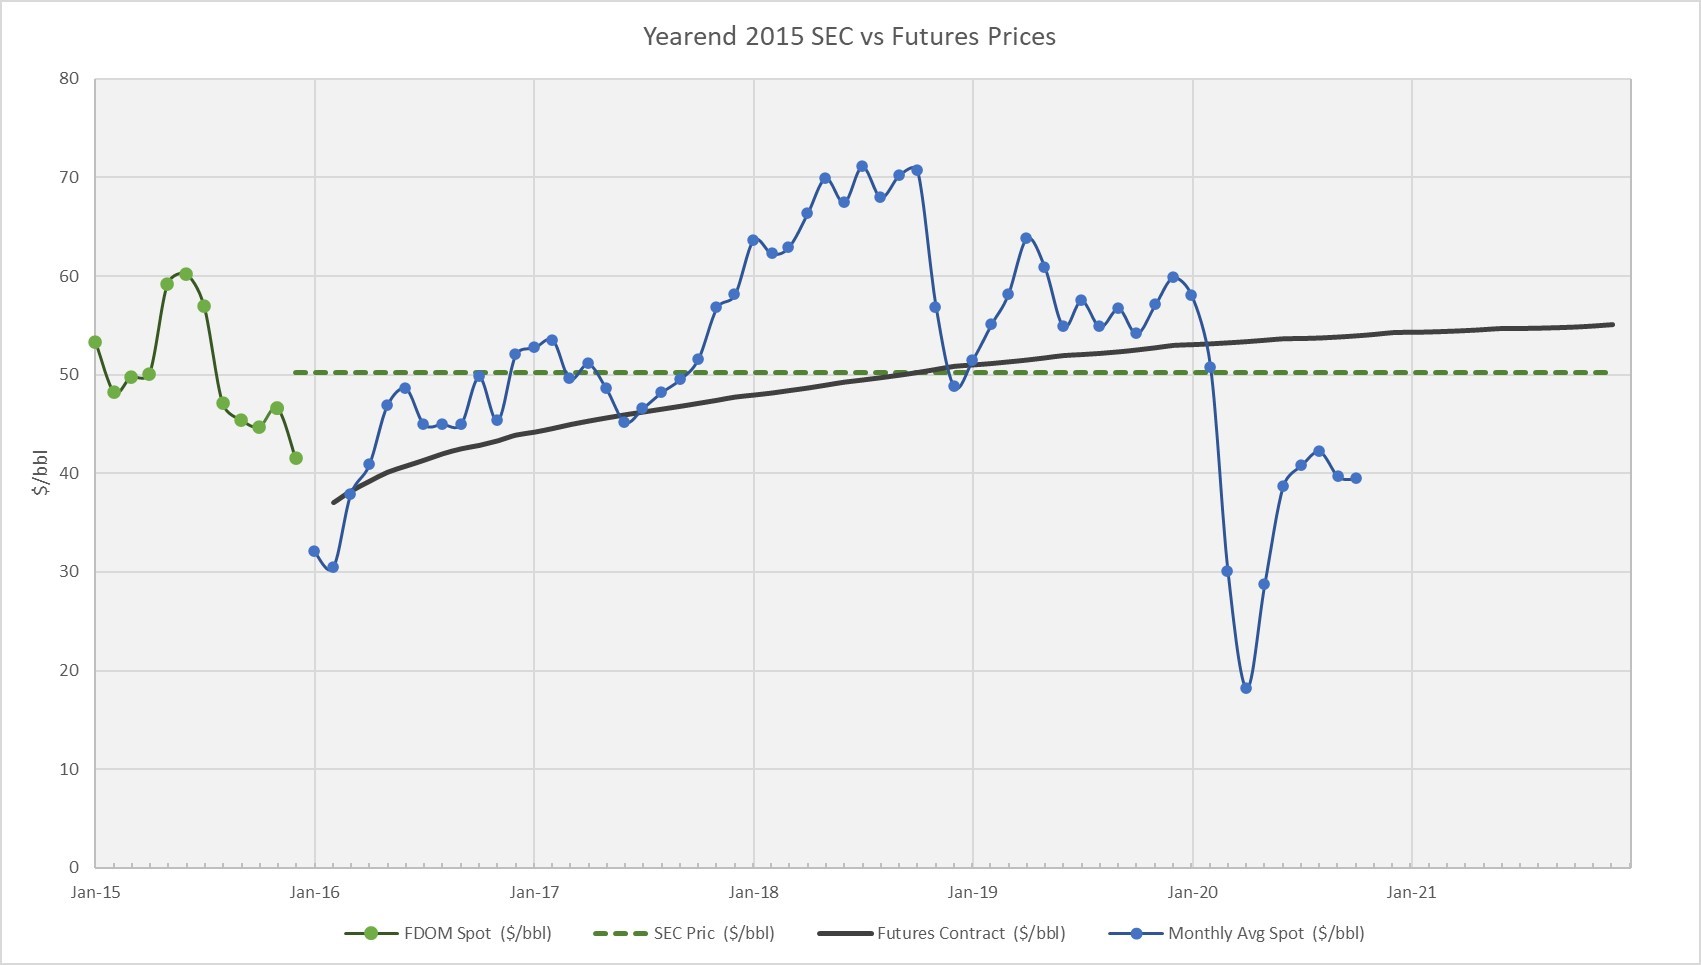
Figure 3 – Case 3: Year-end 2015 SEC price vs Futures Prices
All three (3) cases represent expected market volatility and the resulting pricing forecast. Overall, futures prices more successfully predict actual markets during periods of high volatility, with SEC and futures prices converging during periods of calm, range bound markets. Although it should be noted that the very volatile year of 2020 will result in a year-end SEC price of about 40 $/bbl, which is only slightly below the current spot price of 41.50 $/bbl and about 9% below the three-year futures average of 43.50 $/bbl.
Futures Markets
The New York Mercantile Exchange (“NYMEX”) developed a futures market for West Texas Intermediate Light Sweet Crude (“CL”) in 1983 to help ease volatility of oil prices and its impacts on industry participants. The NYMEX later introduced Henry Hub Natural Gas (“NG”) futures in 1990 for the same market purposes. There are many hydrocarbon products available on the future market; however, these are the most “liquid” contracts on the United States market. The Chicago Mercantile Exchange (“CME”) acquired these futures markets in 2008 and may be referenced at https://www.cmegroup.com.
The hydrocarbon futures exchanges provide a derivatives market for underlying hydrocarbon trading instead of taking immediate delivery. Contracts may be bought and sold for over ten (10) years prior to execution. These contracts are settled by physical delivery between the first day and last day of the month in which the contract is executed. CL/NG contracts are executed in increments of 1,000 bbls-crude oil/10,000 MMBtu-natural gas, respectively. CL/NG trade opens Sunday through Thursday from 6:00 pm ET, closing at 5:00 pm ET the following day. CL contracts close three (3) business days prior to the 25th calendar day of the month prior to the contract month (i.e. Jan 2021 contract settlement date is December 21, 2020). NG contracts close the third to last business day of the month prior to the contract month (i.e. Jan 2021 contract settlement date is December 29, 2020).
Fair market value of oil & gas futures contracts may be determined by:

Since interest rates and delivery costs are generally greater than zero, futures contracts typically trend upwards from nearest contract to farthest contract with respect to time. This is commonly termed ‘Contango’. ‘Backwardation’ occurs when futures prices trend downwards; however, these cases are generally an exception to the norm, created by temporary market disruptions. Overall, futures markets were designed to provide a vehicle for price hedging and risk management against unknown volatility. Regardless, futures trading is not isolated to direct hydrocarbon market participants, leaving futures markets open to vulnerability of speculation and market manipulation by outside participants.
Oil & Gas Futures Definitions
The definitions to the futures contracts language may be researched at the CME website noted above. A sample of the CME CL settlements page is included in Figure 4. The column header definitions are summarized as follows:
- Month – Execution date of the active contract
- Open – Initial contract price of a trading period
- High/Low – Max/Min contract price of a trading period
- Last – Final contract price of a trading period
- Settle – The volume-weighted average price (VWAP) between 2:28 and 2:30 pm ET. On the day of contract expiration, the settlement price is defined by the VWAP between 2:00 and 2:30 pm ET. If there are no trades on a given day, the settlement price defaults to the previous settlement price, if that price is within the current bid/ask spread. The last price may be manipulated by small volume trades outside of the bid/ask spread; therefore, the settlement price provides a stable representation of the daily activity.
- Change – Difference between current settlement price and previous day settlement
- Estimated Volume – Number of contracts traded on a given day
- Prior Day Open interest – Number of contracts that remain open from previous day
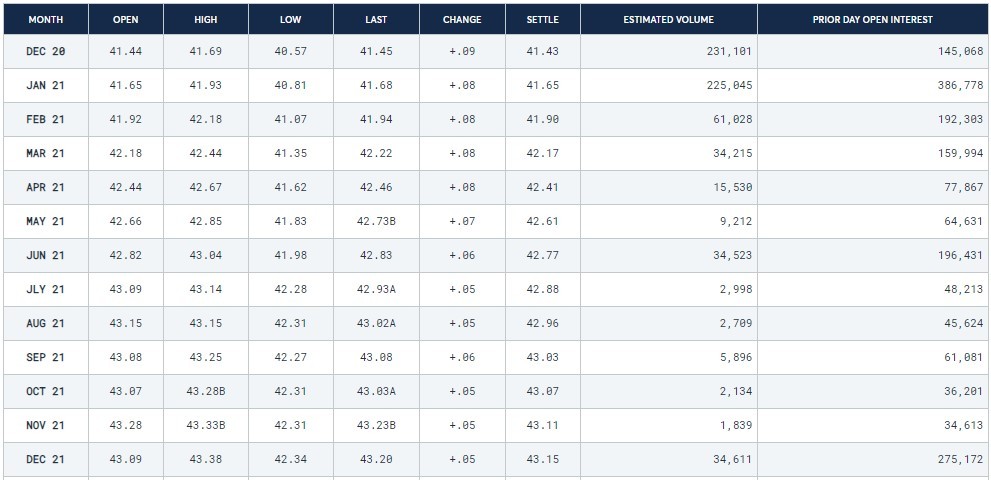
Figure 4 – Sample CME Settlements (https://www.cmegroup.com)
Futures Strip Price Calculation
The most common method for calculating a futures strip price deck is a simple average of settlement prices of all contracts within a given year, holding the average of the fifth year from the effective date flat-for-life. The averages should be tabulated from the close of the previous business day from the effective date of the economic evaluation. Figure 5 displays a sample futures strip price from year-end 2019 (based on December 30, 2019 settlement prices).
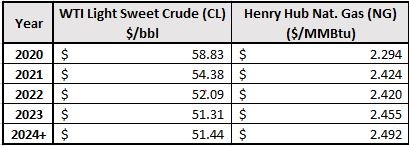
Figure 5 – Year-end 2019 Futures Strip (December 30, 2019)
Often we see elongated futures strip prices, projected beyond five (5) years have been deployed in economic evaluations. There are no details in PRMS reporting guidelines specifying a standard futures strip price case; however, caution should be used regarding futures contracts with little or no merit behind the stated price. The ‘Estimated Volumes’ data, as included in figure 4, provides a measure of certainty in the ‘Settle’ price. The daily volumes traded in the futures market generally concentrate around the nearest contract date and decrease to zero over time. Figure 6 displays an expanded view of the year-end 2019 futures strip price, including years beyond 2024, as well as the summation of the volumes traded on all contracts in that given year.
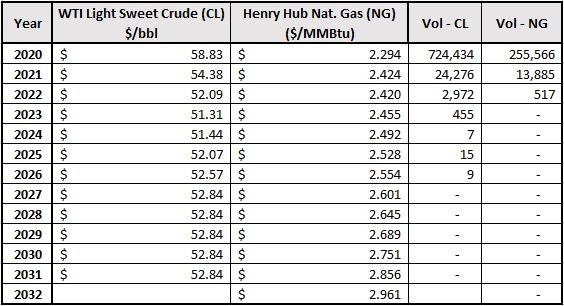
Figure 6 – Expanded Year-end 2019 Futures Strip (December 30, 2019)
The Estimated Volume for CL/NG goes to zero in 2027/2023, respectively. The lack of trading volumes on certain futures contracts indicates little faith among market participants in the respective contract value. Contracts with zero trades are held in place by rollover settlement prices from the last date the contract was traded. In some cases this could be weeks or months between active daily volumes. Though a simple five (5) year futures strip price is often deployed regardless of Estimated Volumes, it’s considered best practice to be prudent in the inclusion of meritless contract values. Figure 7 compares the expanded year-end 2019 futures strip price with 1. all contract values and 2. contract values with at least one (1) Estimated Volume. In this example, crude oil futures strip price case is slightly more aggressive when filtering out contracts with no Estimated Volumes. Conversely, filtering out contracts with no Estimated Volumes for natural gas is slightly punitive in the first five (5) years.

Futures strip prices generally predict market conditions with better precision than SEC pricing in times of higher market volatility. Understanding futures contract trading and employing proper filtering techniques to futures strip price development will yield more reliable economic evaluations. We can help you with that, so feel free to reach out here or contact a CG&A professional at the links below. Thanks for reading!
Contact CG&A about Reserves: reserves@cgaus.com
Check Out Our Website: www.cgaus.com
Special thanks to @Jonathan Schmit, PE and @Shelby Loskorn for their efforts in publishing this series.


