Warning
This article and series is specifically targeted for anyone involved or interested in oil and gas reserves reporting guidelines, methods, issues, calculations and pitfalls. Proceed at your own risk!
Introduction
In our previous article, we discussed the proper selection of benchmark pricing, ensuring that the price index employed best represents the characteristics of the hydrocarbon sales/reserves being evaluated. Ultimately, the pricing benchmark employed should be proportionally correlated to the prices received. Once this selection process is completed, it is critical to define the mathematical difference (‘differential’) between the benchmark pricing and the actual prices received. The differential is the result of location specific marketing, hydrocarbon quality, takeaway infrastructure, transportation, or any variables that affect the actual sales price independently of the benchmark price.
Differential calculations compare the actual price received to the respective benchmark price over the same time intervals, most commonly where average monthly received price is compared to average monthly benchmark spot price. When sales are periodic and sufficient data is available, sales tickets may be compared to benchmark prices on the specific dates of sale. In this article, we’ll cover two differential calculation methods and offer a best practice for forward strip pricing evaluations.
Simple Average Differential Method
The most common method to calculate differentials is often referred to as a Simple Average Differential Method, which mathematically compares the average monthly price received and the average monthly benchmark price. This can be calculated either as a difference (dollars) or as a fraction. The average of the individual monthly variances over a representative period of time (typically trailing 12 months) is the resulting differential to be applied against the benchmark price selected. The method of using individual differences is standard and most common, especially for SEC reporting practices.

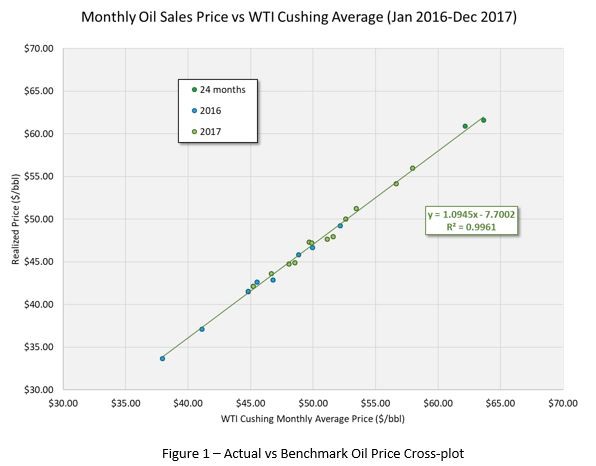
The pricing cross-plot (figure 1) below visually confirms the robust nature of the simple average differential method, with respect to SEC reports and other cases where the indexed price for economic analysis is based on historical averages. This plot shows the 2-year period of 2016-2017 for local crude oil sales prices (realized prices) in the Permian Basin versus the WTI Cushing benchmark. There is a good correlation between the actual sales prices and the benchmark price, confirmed both visually and mathematically with r^2 = 0.99 linear fit of the data. The simple average differential price over the entire 2-year period is -$3.14/bbl and over the most recent 12-months (2017) it is -$2.89/bbl. The SEC price for WTI Cushing at year-end 2017 was $51.34/bbl. If we put this price into the cross-plot equation it yields a differential of -$2.85/bbl. This is very close to Simple Average Differential Method over the same 12-month period.

The simple average differential method, by way of individual monthly differences, works well for SEC reports, where it’s required to use constant prices based on the historical averages. In this case, the constant price and calculated differential are an interpolated result, contained within the available data. However, when the price forecast is not derived on historical averages, this simple average differential method, by way of individual month differences, can lead to significant errors. Examples of these cases may include high volatility of received and/or benchmark prices, price escalation for inflation, forward futures pricing, a constant price case that is materially different than the historical average price, unavailable gas heating value (BTU/CF) data, and any other cases where variables are included that diverge from historical averages. In such cases, it may be more appropriate to calculate the differential based on monthly fractions instead of monthly differences, or consider a more “dynamic” option of using the cross-plot function.
Dynamic Differential Method
The Dynamic Differential Method, which is basically application of the cross-plot linear fit equation, may provide more accurate results in extrapolative price decks not represented by the historical averages. A case study is presented below to identify when/how to deploy this methodology.
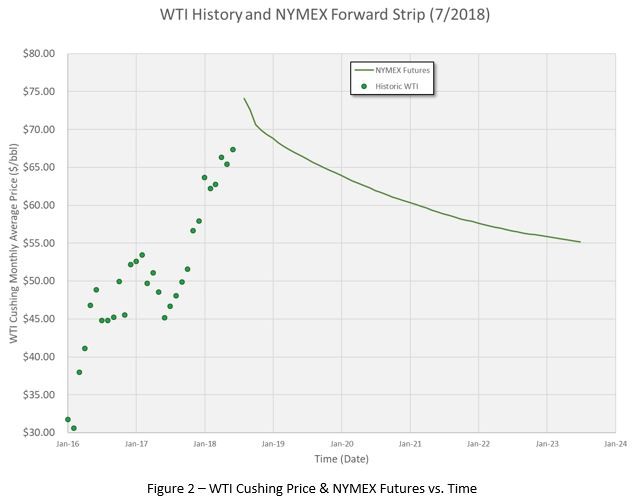
Oil prices were steadily increasing from 2016 through 2018 (figure 2). By mid-year 2018 there were no prices at or below the lower 2017 year-end SEC price or in the 5-year forward futures strip (which was in backwardation). If the January 2018 price of $63.66/bbl was selected, the simple average differential method would still be -$2.89/bbl resulting in an oil price of $60.77. However, if the dynamic cross-plot function is used, the resultant price would be $61.98/bbl or $1.21/bbl higher than the simple average differential method.

This method is “dynamic” because it maintains its validity over ranges of price inputs, which is critical when preparing a reserve report based on escalated or future strip pricing not contained within the historical averages. If the NYMEX Futures forecast from July 2018 were used, the price variation over five years is $74.11/bbl to $55.20/bbl. The Dynamic Differential Method can correctly calculate the differential at all prices in this range.
A Note on Cross-Plots
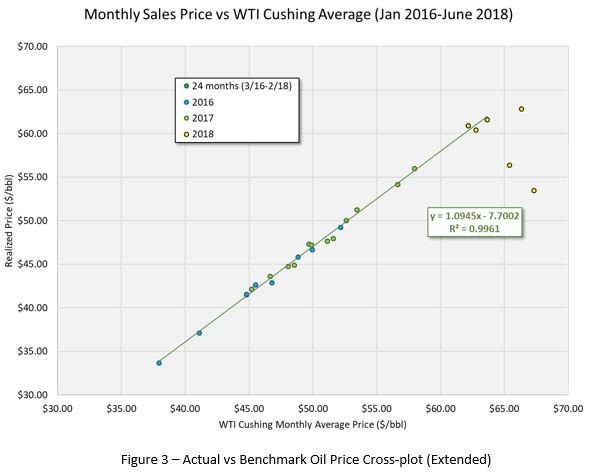
The pricing cross-plots between actual received price and the desired benchmark are also useful at detecting market inefficiencies that should be recognized before using a historical sales period and/or a specific benchmark for pricing. Figure 3 shows an additional six (6) months of data on the pricing cross-plot, with the 2018 data points shown in yellow. Notice how the consistent relationship between sales prices and the benchmark break down in 2018. In this case, the WTI Cushing benchmark was fine, but severe takeaway issues in the Permian Basin caused atypical pricing differentials that reserve evaluators needed to understand to handle correctly. These severe differentials continued for years before enough takeaway capacity was built in the Midland area to rectify these imbalances. It would be incorrect to use the lower differentials calculated from the preceding historical period while these large differentials persist. Conversely, it would also be incorrect to forecast these larger differentials to the end-of-life of the properties when additional takeaway capacity was under construction and would be rectified in the future. Whatever the situation, the cross-plots for the Dynamic Differential Method can detect these situations so that an evaluator can handle appropriately.

Closing
Calculating the proper crude oil and natural gas price differentials for reserves reports has to first start with utilizing the correct benchmark prices, discussed in this previous article. Differential calculations for SEC reports are fairly simple, since the benchmark prices and actual prices received are based on recent prior history. But when market volatility or futures prices are in play, care should be taken to ensure you are applying the right methods to get an appropriate differential. We can help you with that, so feel free to reach out here or contact a CG&A professional at the links below. Thanks for reading!
Contact CG&A about Reserves: reserves@cgaus.com
Check Out Our Website: www.cgaus.com
Special thanks to @Jeffrey Wilson PE, @Jonathan Schmit, PE and @Shelby Loskorn for their efforts in publishing this series.


