Warning
This article and series is specifically targeted for anyone involved or interested in oil and gas reserves reporting guidelines, methods, issues, calculations and pitfalls. Proceed at your own risk!
Introduction
Reserve reports typically present the lifetime oil and gas reserves and expected cash flows for a commercial entity that has ownership in a specific set of properties. The report could involve only one well, or possibly tens of thousands of wells spread out in numerous productive basins targeting different reservoirs and involving various operators. Any proper reserve report should describe the entity, the purpose for the report and detail any complexities so the reader can be fully informed. Most importantly, summary cash flow tables are the “main event” of the reserve report effort, where reserves and values are shown in one very detailed page. It should be pointed out, however, that reserves and cash flows shown in reserve reports DO NOT take into account interest payments, debt service or federal income taxes unless specifically noted. Herein, we will take a brief tour of a reserves-based cash flow page and explain some of its nuances, leave you with an explanatory reference guide, and throw in a bonus rate-versus-time graph to drive home how forecasted production is converted to dollars and discounted cash flow.
Summary Cash Flow Statement
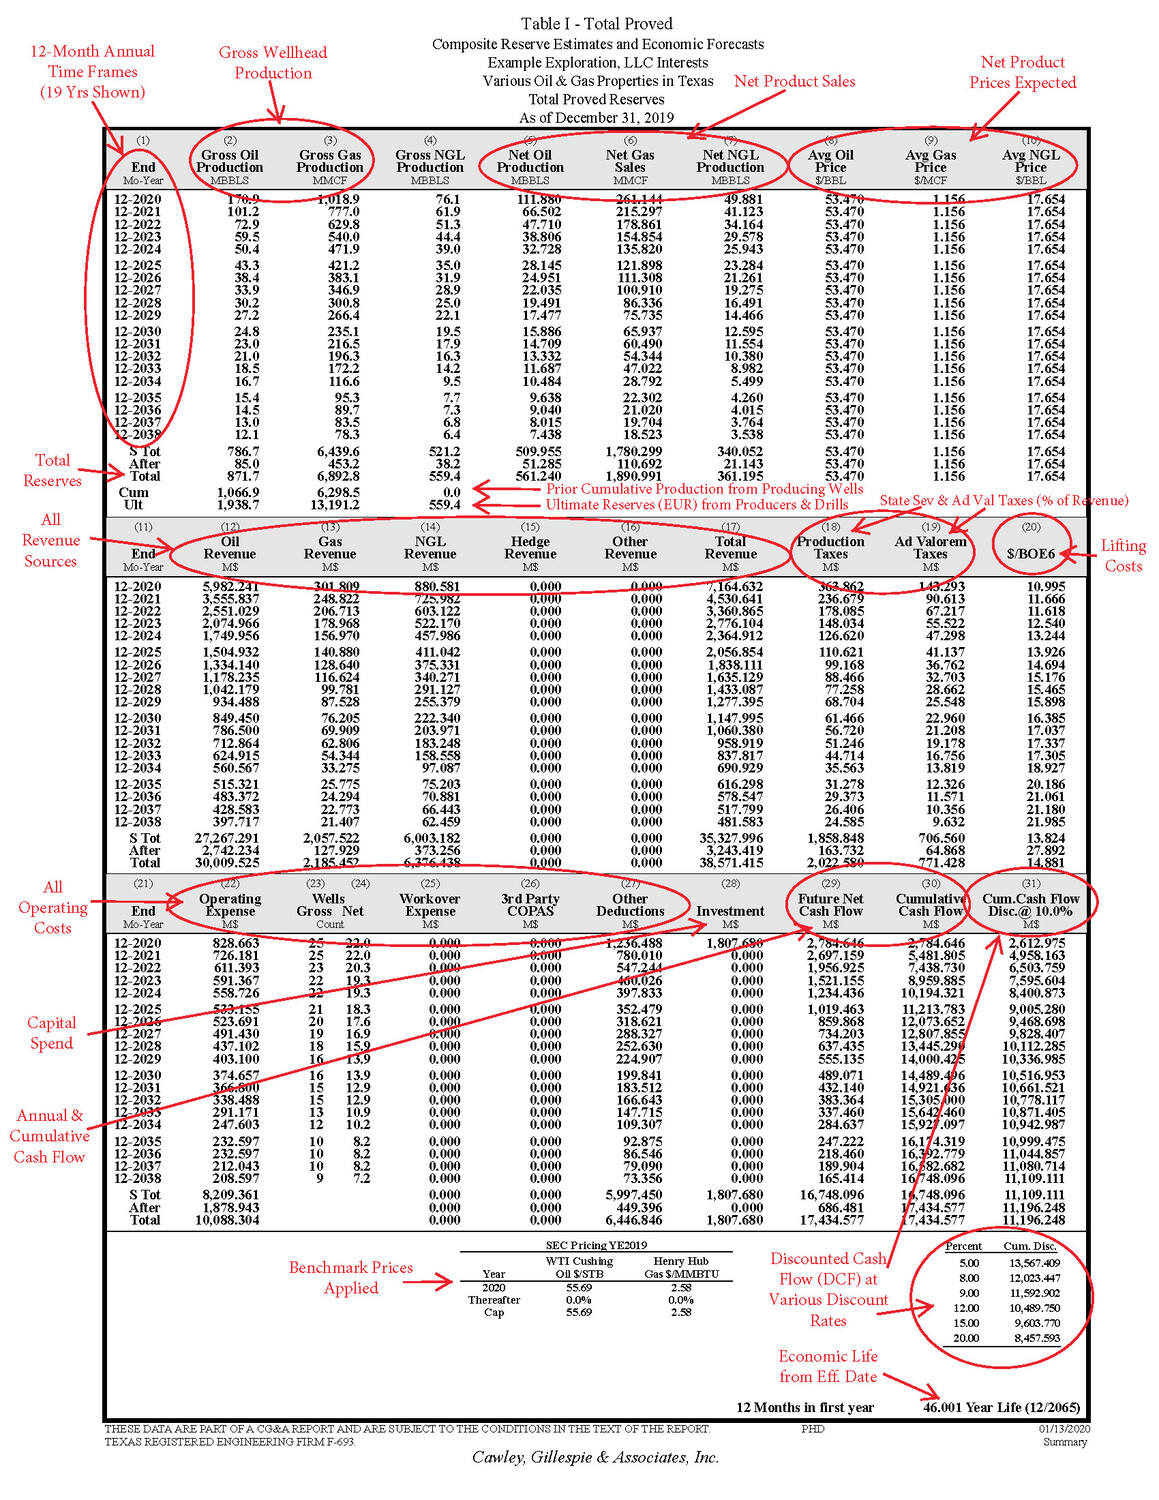
Please refer to the summary cash flow page below (Figure 1), which presents the Total Proved reserves and economics for Example Exploration, LLC’s ownership in certain oil and gas assets in Texas. The first thing to notice is the titles, which clues you in to exactly what this page reveals… reserves and economics, the ownership entity, asset description, reserve classification and development status, and the effective date of the valuation. A quick glance at the bottom of the page indicates that this valuation used SEC pricing for year-end 2019, which coincides with the effective date of December 31, 2019.
Before diving into the numbers shown on the cash flow page, let’s take a high level look at what items this composite page presents. These items are summarized below and annotated on Figure 1.
- Time Frames (usually annual periods are shown at left)
- Gross Production (at the wellhead)
- Net Production (Sales, considering revenue interest and gas shrinkage)
- Average Product Prices (Benchmark prices less differentials)
- Revenues (for hydrocarbons, and other sources if applicable)
- Taxes (State Production Severance and Ad Valorem taxes, typically a % of revenue)
- Operating Costs (Fixed and variable costs, and other appropriate expenses)
- Investments (Capital deployed for remediation, drilling and/or abandonment)
- Cash Flow (Revenue less taxes, expenses, and investments)
- Discounted Cash Flow (“DCF” – cash flow discounted for “time value of money”)


