Oil and Gas Reserves Reporting – Warning
This article and series is specifically targeted for anyone involved or interested in oil and gas reserves reporting guidelines, methods, issues, calculations and pitfalls. Proceed at your own risk!
Background – SEC & SPE/PRMS rules
Both the SEC and the SPE/PRMS rules require that oil and gas volumes must be economic to qualify as reserves, yet there is little specific guidance on how those calculations are to be conducted. In this article, we’ll be focusing our discussion on Operating Expenses (OpEx). What do the different rules systems require and what are best practices?
SPE/PRMS
The PRMS as a principles-based system is less specific than the SEC rules on the subject of Expense and Capital forecasts. The evaluator is free to make forecasts of expenses based on their knowledge and judgement and the intended purpose of the reserve estimates. This latitude allows for forecasts of cost increases or decreases, inflation adjustments, even anticipated future technological improvements and/or efficiencies. Evaluators are still expected to utilize best practices in making these forecasts and to fully disclose the assumptions that are being used for the estimates. Because of this flexibility, evaluators must be even more aware of best practices and potential pitfalls in forecasting expenses where errors can be magnified to a much greater degree than with constant and current cost assumptions (aka SEC rules).
SEC & FASB
Like PRMS, there are not many specific guidelines regarding expense forecasts for SEC-compliant estimates. The definition of Oil & Gas Reserves (SEC Reg S-X 210.4-10 (a)(2)) states that the estimates be made “under existing economic and operating conditions, i.e., prices and costs as of the date the estimate is made.” Financial Accounting Standards Board (FASB) 69 (30)(b) presents the same concept as, “Future development and production costs . . . be computed by estimating the expenditures to be incurred in developing and producing the proved oil and gas reserves at the end of the year, based on year-end costs and assuming continuation of existing economic conditions.” This we often paraphrase as “current and constant costs.”
Current Oil & Gas Cost Determination Period
While the literal interpretation of “current cost” would be the cost on December 31 for a year-end report, or the cost immediately preceding the effective date of any report, forecasting costs based on a single day is inherently problematic. The best practice is to base the current cost on a minimum of the previous 12-months of data. One year of history is ideal to protect against seasonal variations that can occur due to temperature or market variations that exist in annual cycles. Twelve months of data also provides enough data for accounting anomalies to appear and be corrected. Certain expenses, such as Ad Valorem (Property) taxes may only be paid once per year. Additional historical cost data can often provide even better estimates but working with 12-month increments is always preferred.
It is usually not necessary that a 12-month history be a calendar year, any recent sequential 12-month period is sufficient. In fact, evaluators should be very wary to use the most recent months of data provided. It is very common for accountants to revise lease operating statements (LOS) for a couple months or more which means the most recent months are not always reliable. For example, if it’s late January and the LOS for the previous Jan-Dec period has just been made available, you may want to consider using the most recent Nov-Oct period instead.
Fixed vs Variable Costs
Operating costs can nearly always be grouped into Fixed and Variable components, with the Variable component being the portion that is associated with production volumes, and the Fixed component being constant and independent of production volumes. If you have detailed LOS available, you may be able to identify individual cost ledger items that are fixed and/or variable. Fixed costs might be field staff salaries, compressor rentals, facility maintenance, etc. Variable costs might be chemical treatments, electricity (for pumps/compressors/etc.), trucking, etc. Once all of the costs are categorized, you can then sum or average them separately to determine the fixed cost/month or cost/month/well and the variable costs along with the production during that same timeframe to determine cost/bbl and/or cost/mcf.
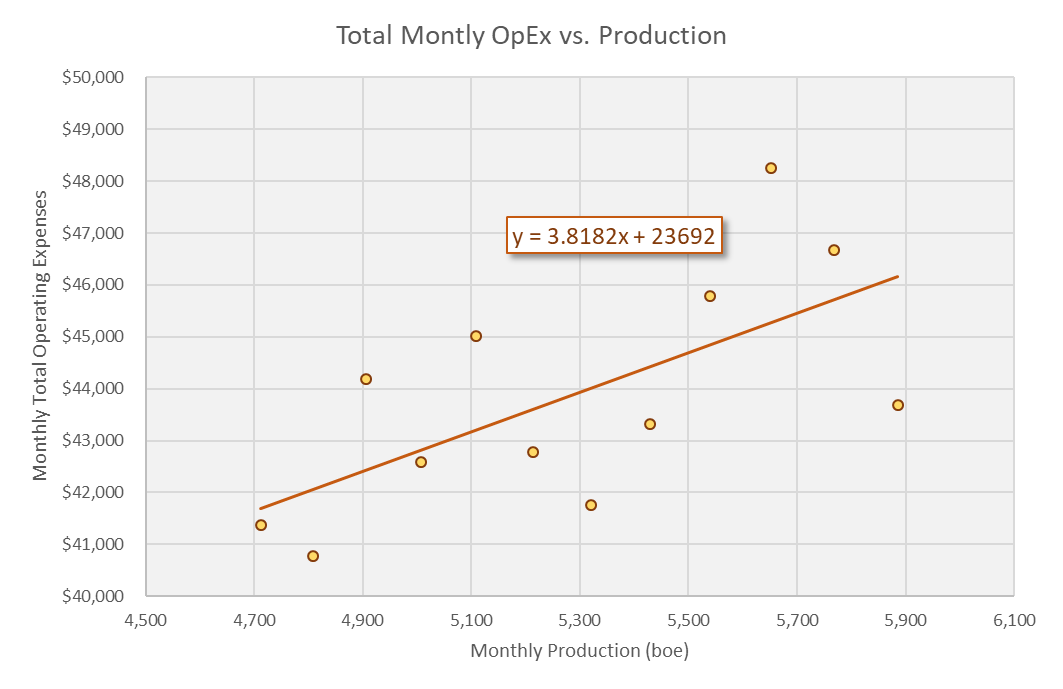
If detailed cost data is not available, you can often achieve a similar result by comparing the total costs and production on a monthly basis. An example of a cross plot of 12 sequential total monthly costs versus monthly production values is shown in Figure 1. A linear fit of the cross-plot data provides estimates of the fixed and variable cost components. This example yields a fixed cost of $23,692/month and a variable cost of $3.82/boe. (The actual values used to generate this hypothetical example were $22,204/month average and $4.10/boe.)

The evaluator needs to consider which product is driving the expenses; oil, gas or both. Properties with large amounts of water production may drive the need to forecast total fluids to correctly forecast expenses.
Upward and Downward Oil & Gas Industry Cost Trends
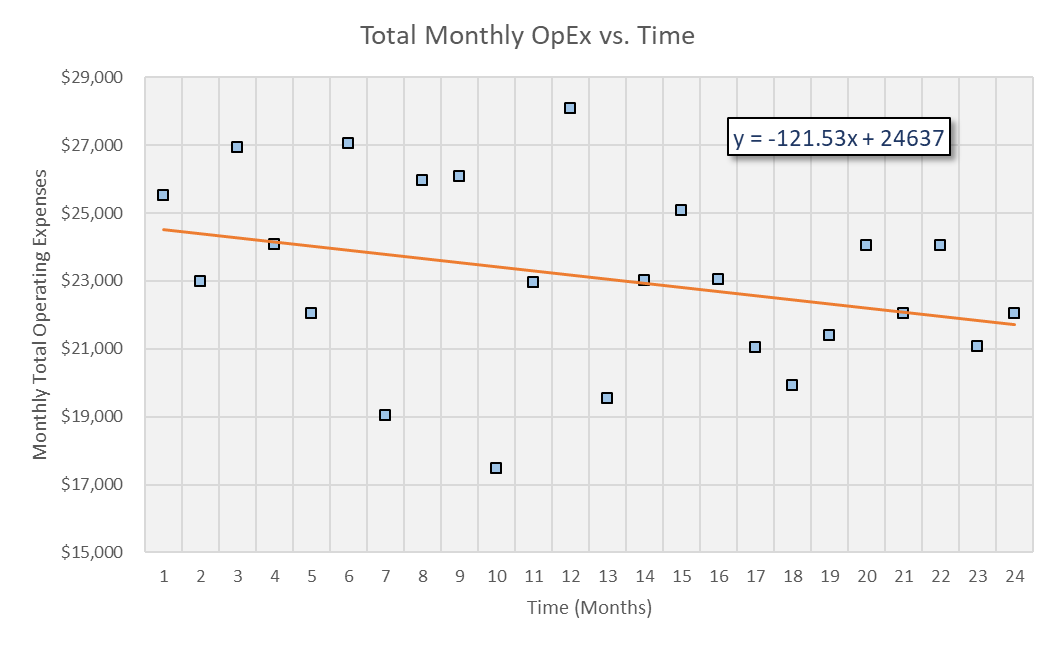
In some cases, operating expenses are observed to be rising or falling over time. If these trends are real, and not just an artifact of data scatter, the endpoint can and should be used as the current cost. Figure 2 is a hypothetical example of total costs over a two-year timespan. Recall the FASB wording that expenditures be estimated “at the end of the year”. In this particular example, the trend lines shows that monthly costs are dropping $121.53 per month, on average. If we use this trend to calculate the average monthly cost on the last month (24), the current cost would be $21,270/month. This is over $1000/month lower than the average over the most recent 12-month period ($22,204).
In order to have confidence that this end-point cost is real, it is helpful to know if there is a reason behind the downward trend. It could simply be declining production (if the variable cost hasn’t already been removed). Perhaps there is an operational change in the field that has been reducing costs. This type of information should be considered before blindly booking an endpoint cost to ensure that it is real and not a mathematical anomaly.


