Warning
This article and series is specifically targeted for anyone involved or interested in oil and gas reserves reporting guidelines, methods, issues, calculations and pitfalls. Proceed at your own risk!
Introduction
The Securities and Exchange Commission’s (SEC) stated rule for prices used to estimate oil and gas reserve value is found in the Proved Reserves definition of Regulation S-X [210-4-10(a)(22)(v)] where it states, “The price shall be the average price during the 12-month period prior to the ending date of the period covered by the report, determined as an unweighted arithmetic average of the first-day-of-the-month price for each month within such period, unless prices are defined by contractual arrangements, excluding escalations based upon future conditions.”
This seemingly straight forward statement does leave some details unexplained for the oil and gas industry, however. What if the commodity markets are closed on the first day of the month? Which market price or hub (benchmark) should be used? What if price sources don’t agree? This article addresses these and other questions regarding SEC-related hydrocarbon pricing guidelines.
What Pricing Hub Should be Used?
The SEC regulations do not require the usage of specific pricing hubs, nor does a single hub need to be used. The evaluator has the latitude to choose whichever pricing hub is most appropriate for each property, since the location of the property being evaluated is relevant to the pricing hub of the hydrocarbons being marketed. Most reserves evaluators choose to use one or more of the major hubs, such as West Texas Intermediate (WTI) or Europe Brent for crude oil and Henry Hub (HH) for natural gas. The advantage of these hubs is they are widely known and traded by potential recipients of a reserve evaluation. But in many situations another hub may be more appropriate. For example, hydrocarbons from fields in the Gulf of Mexico are typically traded into St. James (LA) terminal or Mont Belvieu (TX). But any selected hub should have significant, regularly-traded volumes in order to determine the first of month prices.
If the price differentials are calculated correctly as part of a valuation, and the commodity trading markets are working efficiently, it typically does not have a material impact on value which pricing hubs are selected. However, when hubs become constrained due to inadequate take-away capacity, the pricing (trading) becomes erratic and differentials become very difficult to calculate. Evaluators may consider alternate pricing hubs if the properties don’t flow into those hubs. In any valuation or reserve report, a best practice is to disclose the pricing hub(s) utilized.
What if the Oil & Gas Commodity Markets are Closed on the First Day of the Month?
On days that the markets are closed, the previous day’s prices are still in effect. When the market is closed the most recent trade date PRIOR to the market being closed is used. The January 1st prices always present a challenge since it is a holiday and the markets are closed. For example, on Tuesday Jan. 1, 2019, this situation was at an extreme for Brent crude prices. The holiday weekend created a situation where Brent commodities had not traded since Friday Dec. 28, 2018. That was the correct price date to use for the Jan. 1, 2019 Brent price even though it was four days prior. However, the markets were open in the U.S. on Monday Dec. 31, 2018, so for WTI crude that was the correct price date to use for SEC price calculations.
Gas follows similar patterns, except it has the additional nuance of trade date versus flow date. The spot market that trades on a given day is for the product flowing on the following day. For example, July 1, 2020 was on a Wednesday and the markets were trading as normal. However, the spot market price on June 30, 2020 is referenced since those contracts are for production flow on the next day.
What are the Best Sources for Oil & Gas Industry Pricing Data?
There is no “best source” for historical, spot and future oil and gas price data, and many sources relied upon years ago are no longer available. There are multiple sources for product prices and often they don’t agree. It’s common for different sources to be off by a minor amount, but sometimes they have material differences. There are multiple reasons why different amounts can be quoted. Commodity trading is a complicated business with thousands of transactions both within a trading day and as traders work to close their books each day. These detailed nuances are far beyond any guidance provided by the SEC or FASB. Therefore, it’s important to be consistent with your pricing data source and use a reputable source for pricing information.
In the USA there are several current data providers that are used more frequently due to their reliability and/or consensus of usage. These sources, many which offer historical, spot and futures pricing, are shown below (with the first four being primary sources for CG&A):
- U.S. Energy Information Administration (eia.gov) – WTI Cushing Spot & HH Spot
- Platts Gas Daily (spglobal.com/platts – requires subscription to newsletter)
- Plains Marketing, L.P. (plainsallamerican.com) – WTI Posted Price Bulletins
- INO NYMEX Futures (ino.com) – NYMEX Crude Oil & NYMEX Nat Gas
- Bloomberg NYMEX Prices (Bloomberg.com) – Daily “Spot” Oil & Gas (1st Future)
- Wall Street Journal (wsj.com) – NYMEX Crude Oil & NYMEX Nat Gas
- Thomson Reuters (reuters.com) – NYMEX Crude Oil & NYMEX Nat Gas
A Note on Oil & Gas Industry Price Differentials
We’ll be discussing price differentials in the next article, but it’s worth stating that while the use of average first of month prices is required by the SEC, these prices are NOT required for the determination of price differentials. Further, first of month prices are not appropriate for calculating differentials, though we still see evaluators doing this from time to time. A property’s commodities are typically sold continually throughout the month when selling into a pipeline, or at discrete intervals of time when sales products are trucked or offloaded by tanker. Consequently, the price differentials should be calculated by comparing the actual realized monthly price to the average benchmark (hub) price. If the property has a limited number of specific sales dates when trucked or open market tanker shipments, the benchmark prices on those specific sales dates can be used to determine price differentials; not first of month prices.
What are the Year-End 2019 and 2020 SEC Prices?
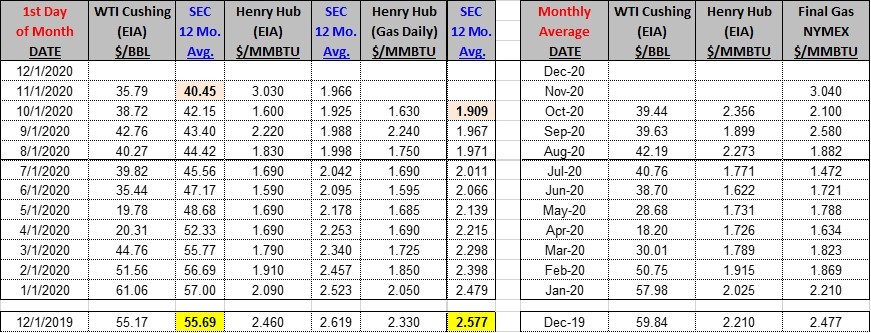
The year-end 2019 SEC prices were calculated to be $55.69/BBL and $2.577/MMBtu for crude oil and natural gas, respectively, using EIA data for WTI Cushing and Platts Gas Daily data for Henry Hub benchmarks. At this time, year-end 2020 prices cannot be determined since December 1st has not traded as of this article date (11/6/2020). However, based on November 2020 pricing trends, it appears the year-end SEC prices will be approximately $39.00/BBL and $2.00/MMBtu using the same benchmarks. As you can imagine, these lower SEC prices for year-end 2020 will be impactful to reserve valuations.


